
Looking at Systems sustainability for Medical Billing

Original Service Blueprint

Model Categorization: Identify the model you have chosen. In which category of the models discussed in this course does it fit?
01.
Improving Interrelationships and Circularity: How can this model be enhanced to better reflect the interrelationships and circularity principles explored in this course?
02.
03.
Shifting from Events to Systems: How can the model be modified to represent a system's structure, focusing more on the underlying patterns rather than isolated events?
04.
Visual Representation: Based on your proposed improvements, create a new visual representation of the model that incorporates the above changes.
01.
I have selected to employ a service blueprint. This is a tool that shows how people, items (physically or digitally), and actions connect at different touch points of an interaction. It’s especially useful for complex services that involve multiple channels and departments.
A service blueprint is a process model used in service design to visually map out and analyze the components and interactions within a service. It is a liner sequence of events and provides a structured view of the entire customer journey, showing both visible and invisible actions.
02.
IMPROVING INTERRELATIONSHIPS AND CIRCULARITY:
Give an example to illustrate the event-pattern-structure-mental model levels of intervention.
(See blueprint above)
The overall purpose of this blueprint is to be able to understand the aspects of medical billing that are not patient centered and do not serve to improve quality of care.
My intent was to identify weaknesses and establish the gaps, and opportunities for a better and more succinct way for a patient to deal with and understand the foundation for the process to account to what makes medical billing and how to better navigate the multi system and process procedure.
The main focus was on the interrelated connections, between the process, relationships, pain points, and the area of opportunities.
MODEL CATEGORIZATION:
03.
SHIFTING FROM EVENT TO SYSTEMS:
To enhance a service blueprint with systems design I incorporated a Causal Layered Analysis. I began with layering in different level of awareness and interconnections to capture both the workflow and the underlying drivers.
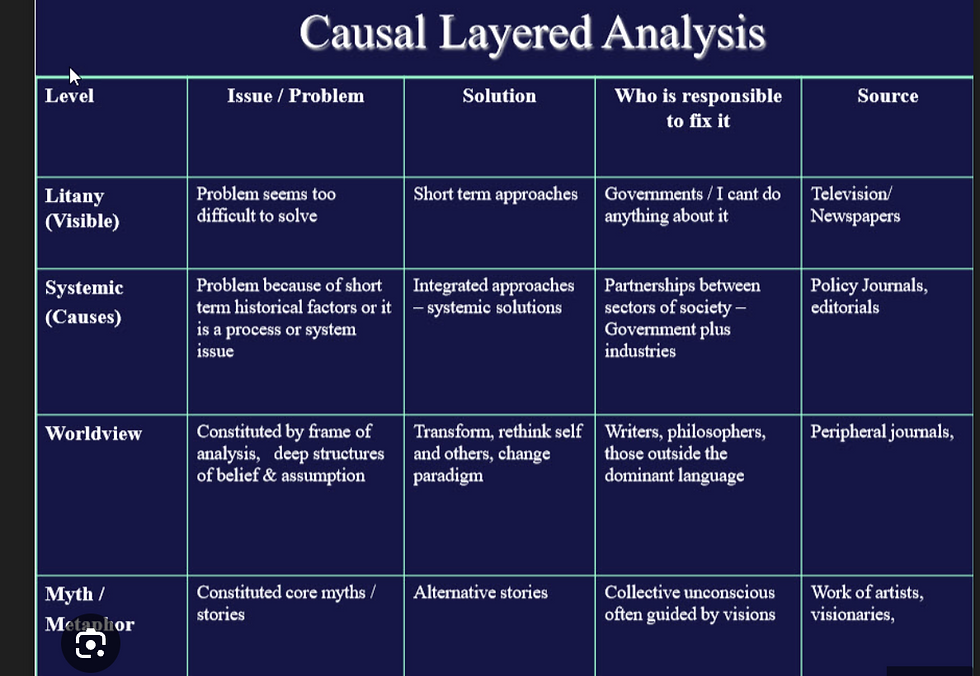
Shifting from events to systems continued:
5. Root cause Insights:
2. Internal Adjustments:
Map how departments respond to recurring issues or feedback, highlighting continuous improvements in response to system-wide insights.
3. Cross-functional interactions and collaboration points:
Show where multiple teams (e.g., marketing, support, and operations) interact. This will reveal interdependencies and shared responsibilities, emphasizing the broader, interconnected system that supports the customer experience.
Identify where tasks transfer between departments or systems, showing how delays or miscommunication can ripple through the service.
4. Handoffs and Dependencies:
Use patterns identified in recurring issues to show potential root causes (e.g., resource limitations, policy constraints) and map them within the blueprint. This emphasizes how structural factors impact service delivery beyond individual actions.
Based on your proposed improvement , create a new visual representations of the model that incorporates the above changes
04.
VISUAL REPRESENTATION:
How can the model be modified to represent a system's structure, focusing more on the underlying patterns rather than isolated events?
Underlying Systems: Map out underlying systems (e.g., technology platforms, regulatory frameworks) that support or limit processes. Including these dependencies helps visualize the broader ecosystem that supports front stage and backstage activities.
7. Systems Interconnections:
6. Sustainability and Circularity Elements:
Resource Reuse: If relevant, show points where resources or processes are reused, recycled, or improved, reflecting circularity principles. For example, knowledge from one service interaction could be repurposed for training or process optimization.
1. Feedback Loops of Customer and Staff:
Capture points where customer and staff feedback inform process adjustments. This addition helps by depicting adaptive responses and improvements based on real-world experiences, showing a circular approach within the service.
-
Handoff/ dependencies/delays.
-
Define departments by color.
Journey Map
Causal loop interactions
to show collaboration
Resource
Sustainability
